LILT Analytics Overview
LILT Analytics provides comprehensive insights into the performance and accuracy of AI translations over time. This article will guide you through the various metrics and visualizations available in LILT Analytics. Monthly analytics data is available at the beginning of the following month. We only display complete monthly datasets.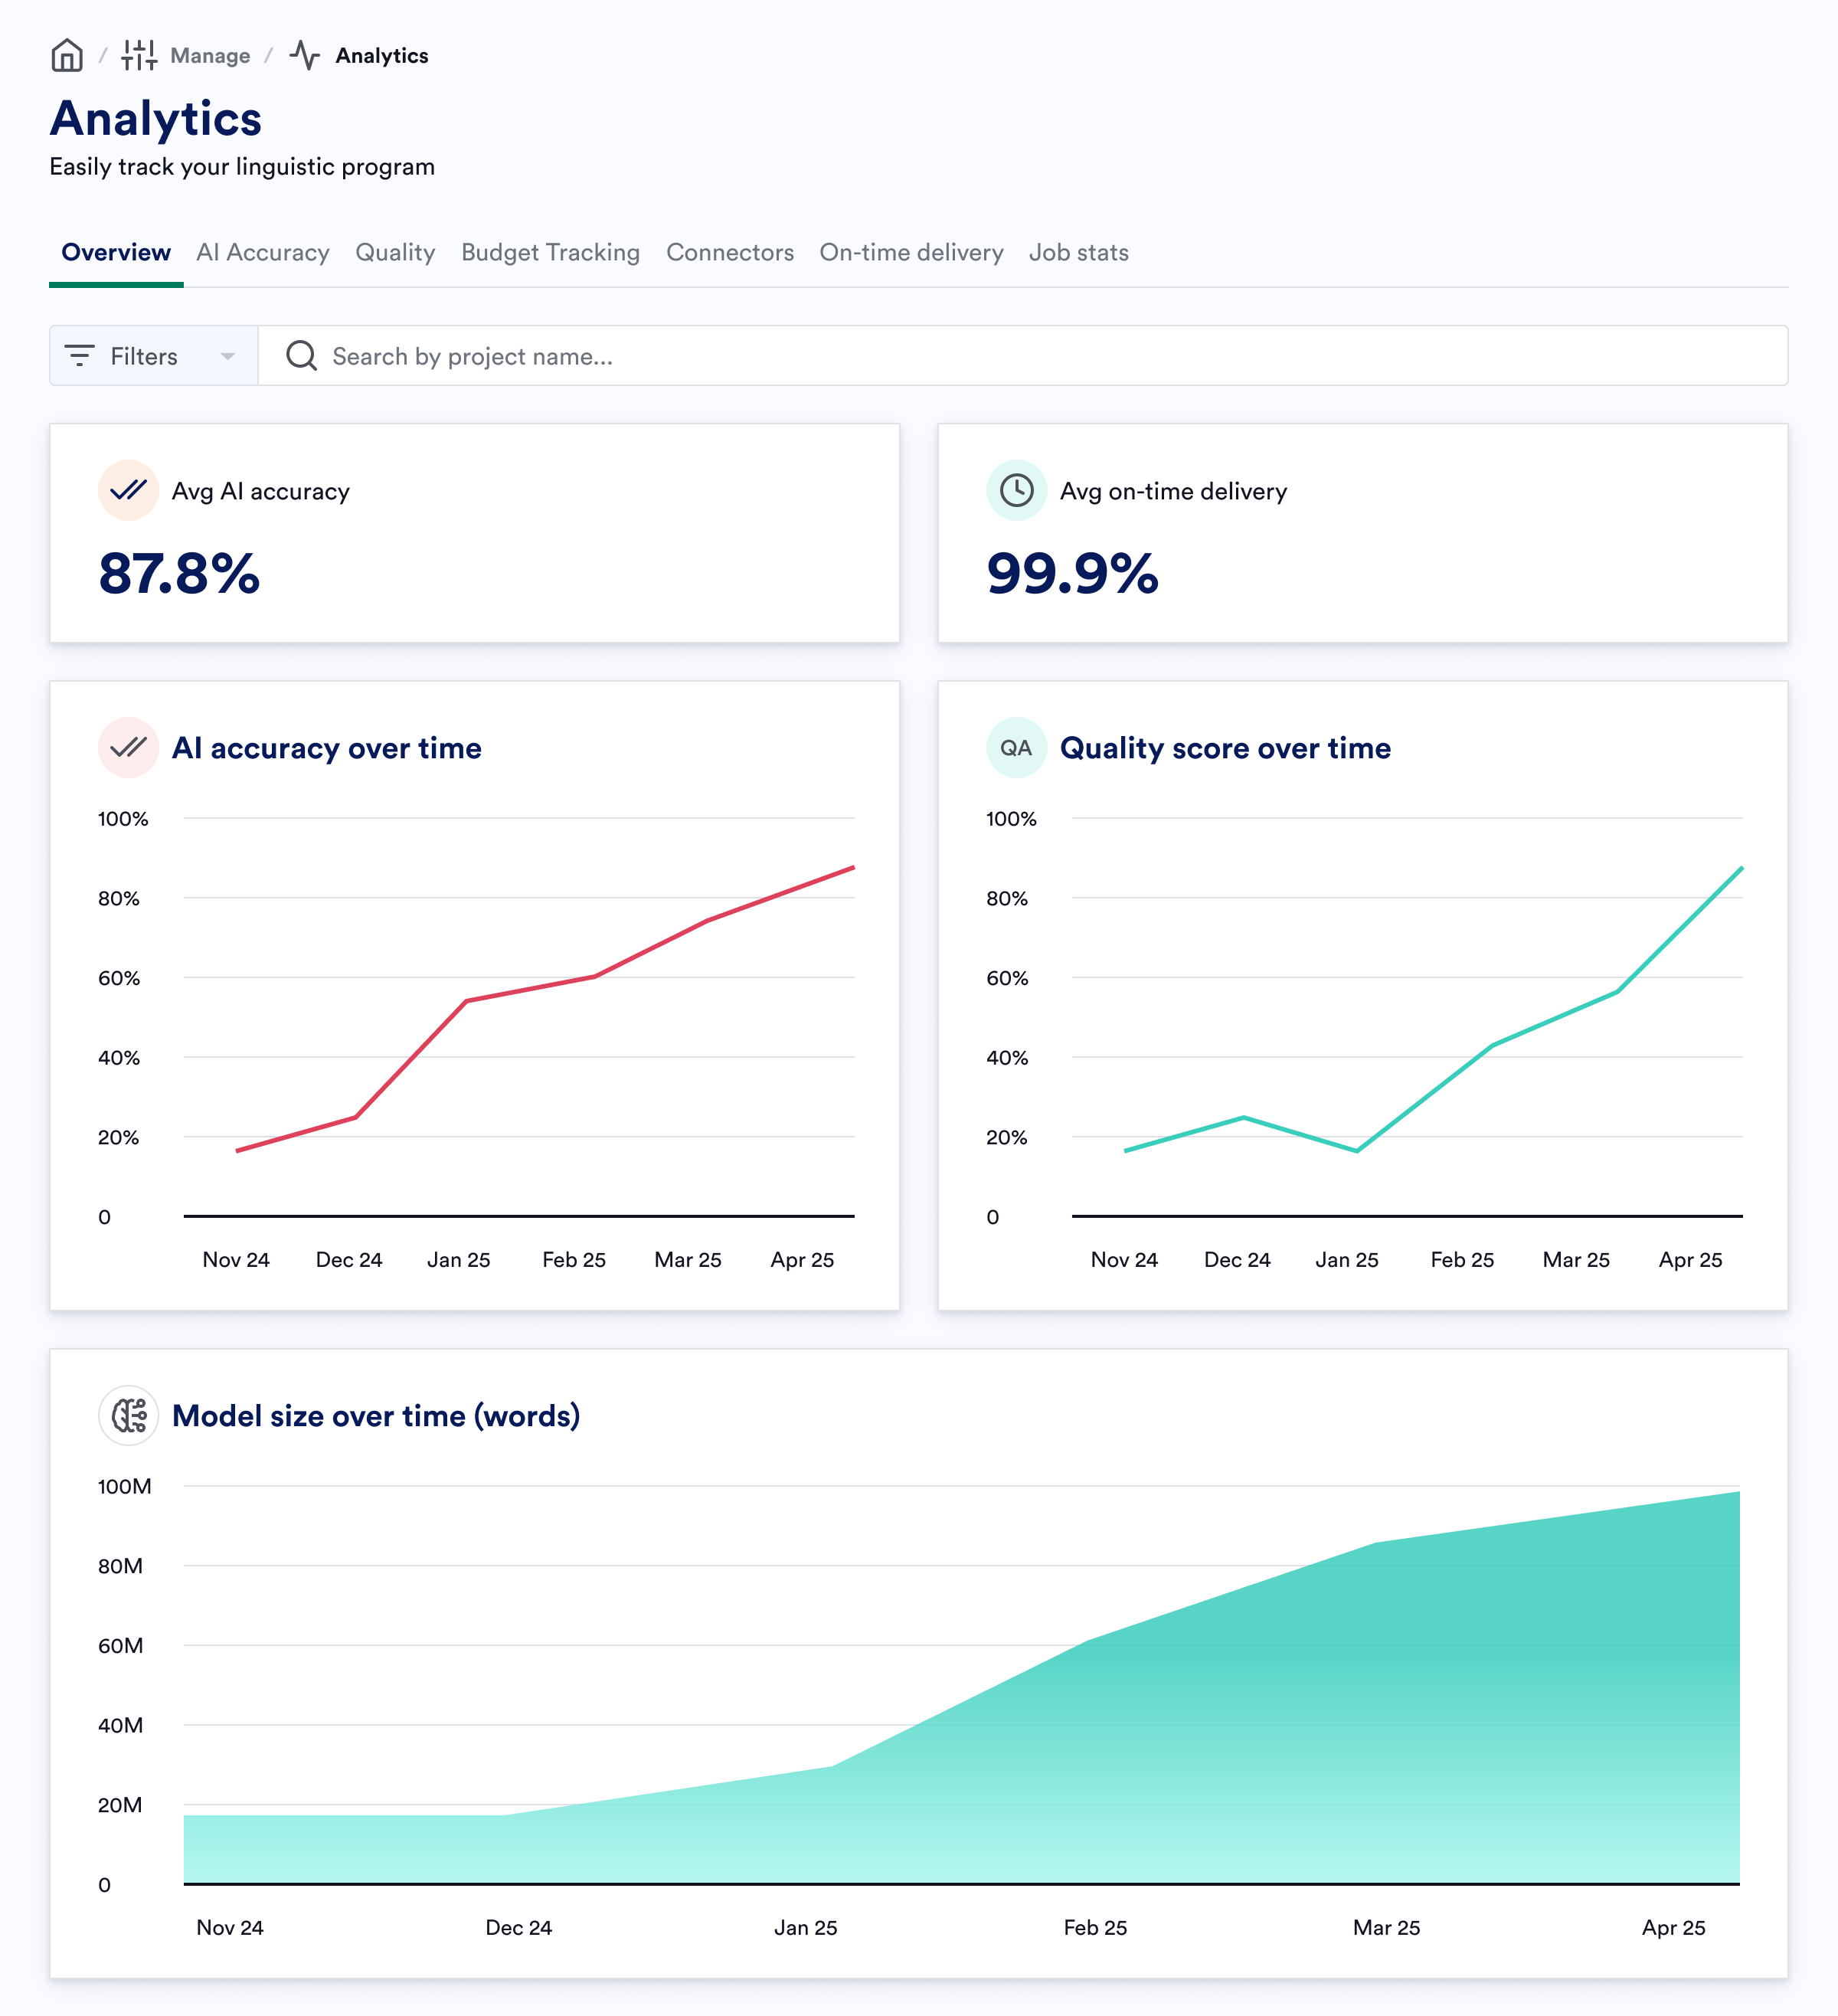
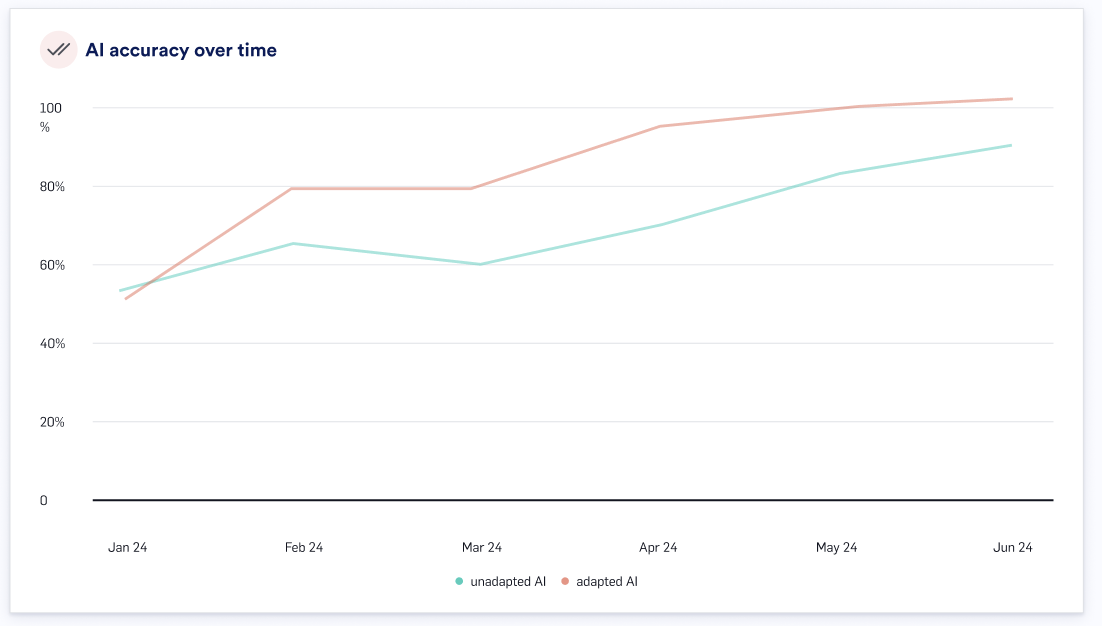
AI Accuracy
AI Accuracy provides insights into the accuracy of AI suggestions across two models and workflows: Unadapted AI (pure MT) and Adapted AI (LILT Contextual AI model with Data Sources).- Unadapted AI (Green): Represents the raw AI translation accuracy without any modifications (LILT’s baseline models).
- Adapted AI (Orange): Shows the AI translation accuracy after adjustments and improvements from Fine Tuned Data Sources (customer’s fine-tuned models).
AI Accuracy Per Language Pair
The “AI Accuracy Per Language Pair” table provides detailed accuracy metrics for different language pairs over several months. This table helps identify which language pairs have higher or lower accuracy and track their performance trends. AI Accuracy does not differentiate between locales, and we track at the language level.Quality
Quality metrics displays data from either the Review or Secondary Review stage (whichever occurred last). Please note that if you do not regularly have a Secondary Review stage, then this page will reflect a restricted view (see below).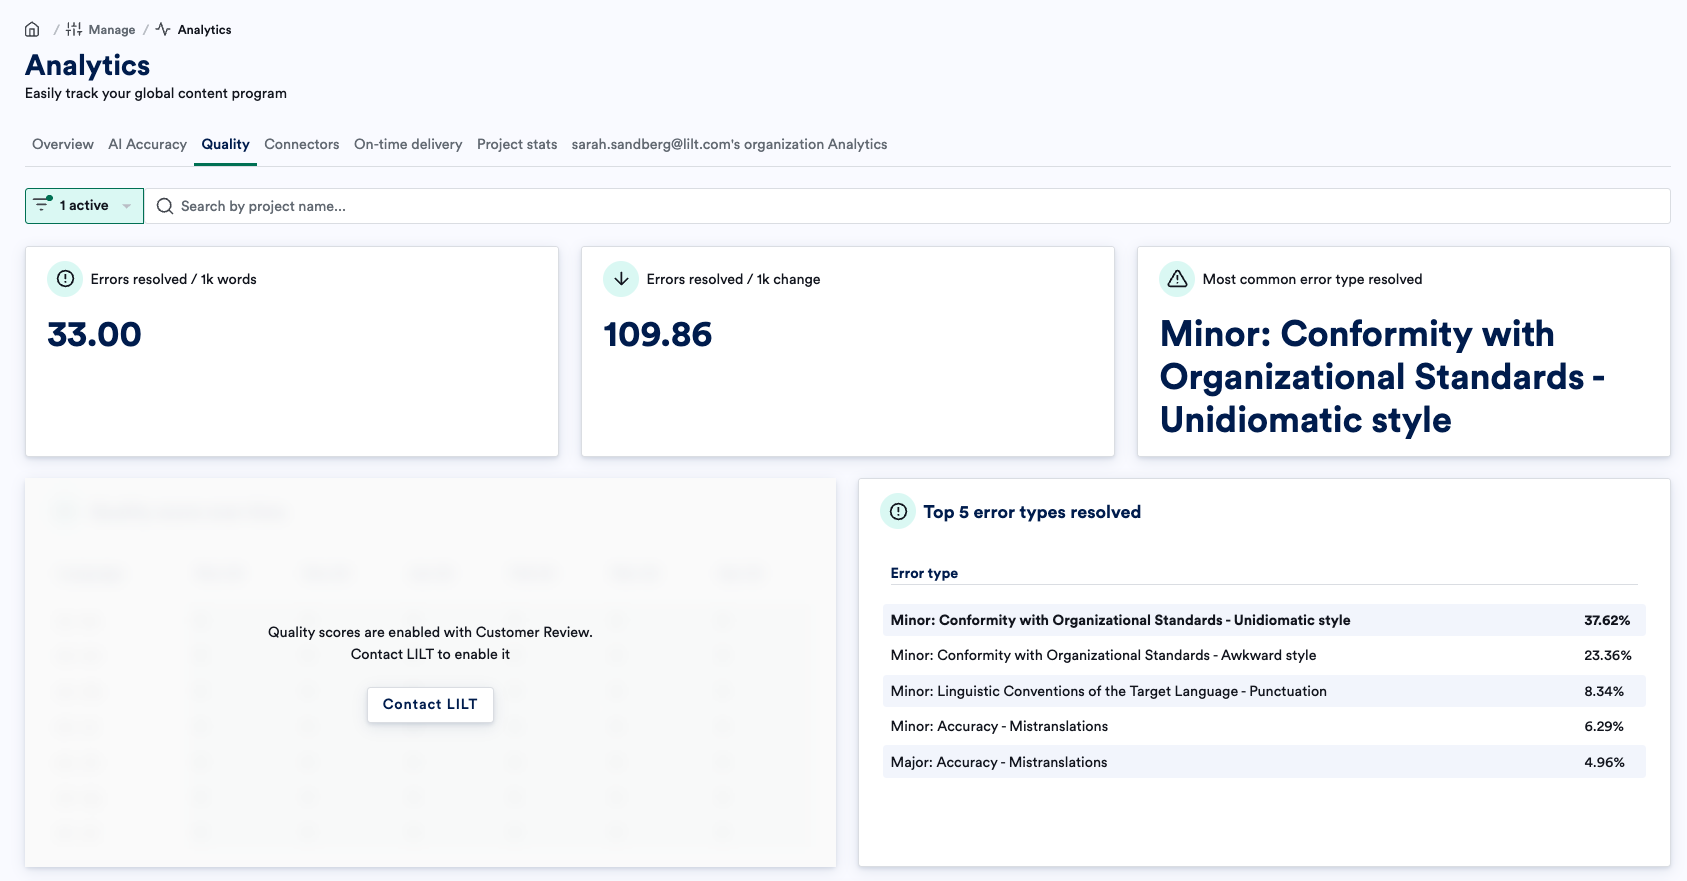
Errors Resolved / 1k Words
This metric shows the number of errors resolved per 1000 words that were resolved between the last month and the current month.Errors Resolved / 1k Change
This metric shows the numerical difference in number of errors per 1000 words that were resolved between the last month and the current month.Most Common Error Type Resolved
This metric shows the most common error type that was found and resolved during the LILT review step based on the MQM framework.Model Size Over Time
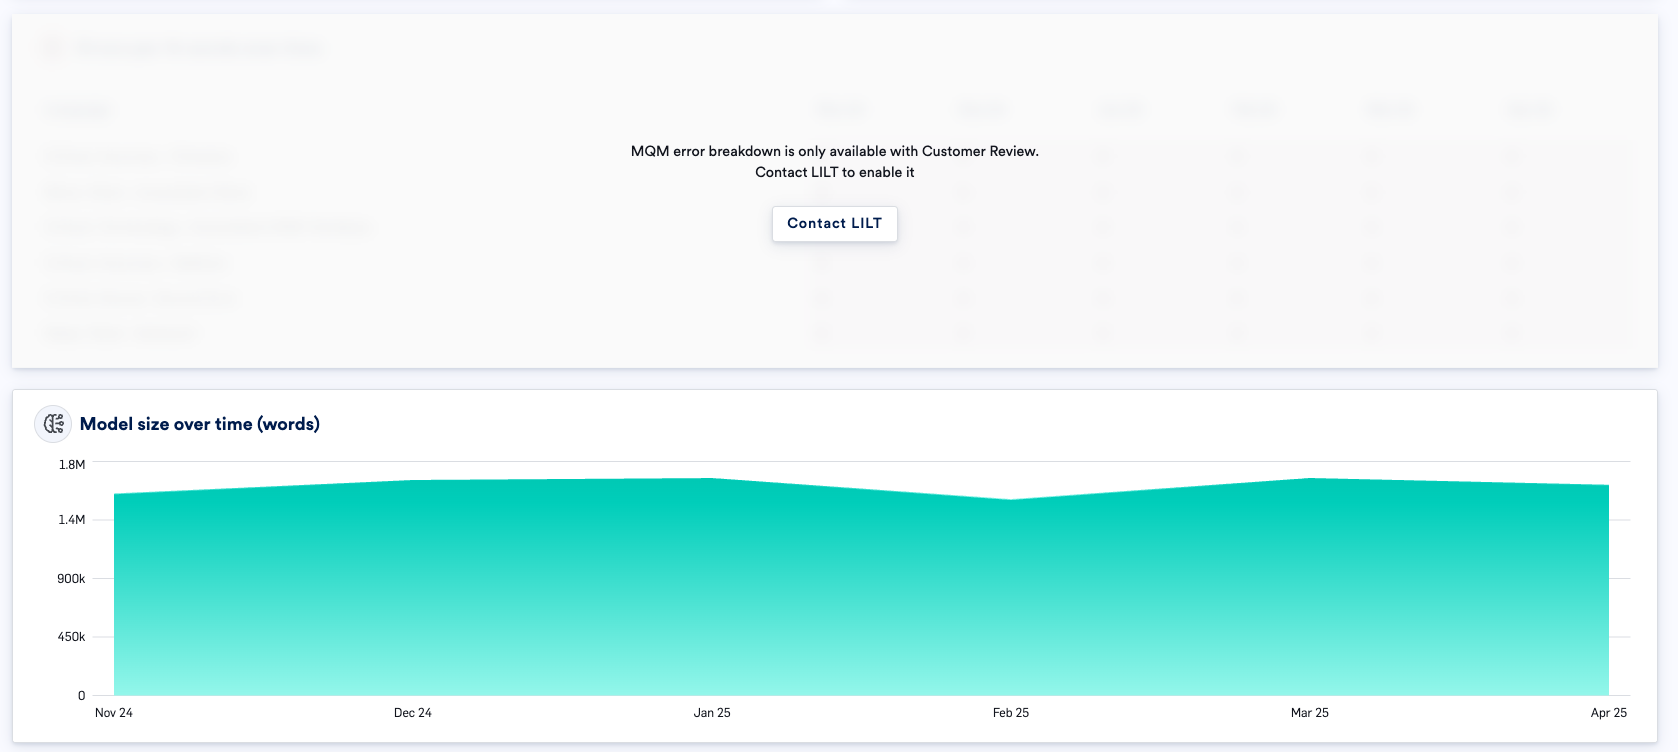
The “Model Size Over Time” chart tracks the growth of the LILT AI model in terms of the number of words added per month. This metric shows how the AI model expands its knowledge base to improve translation accuracy.Quality Scores Over Time
If you do not have the restricted quality score view because your workflows have a Secondary Review stage, then you will see a chart for Quality Score Over Time. This table breaks quality scores down by locale and gives insight into average scores by language/locale pair. These scores dynamically update when filters are applied. This data can give clearer insights into quality performance, making it easier to decide whether quality is high enough to switch to instant translation.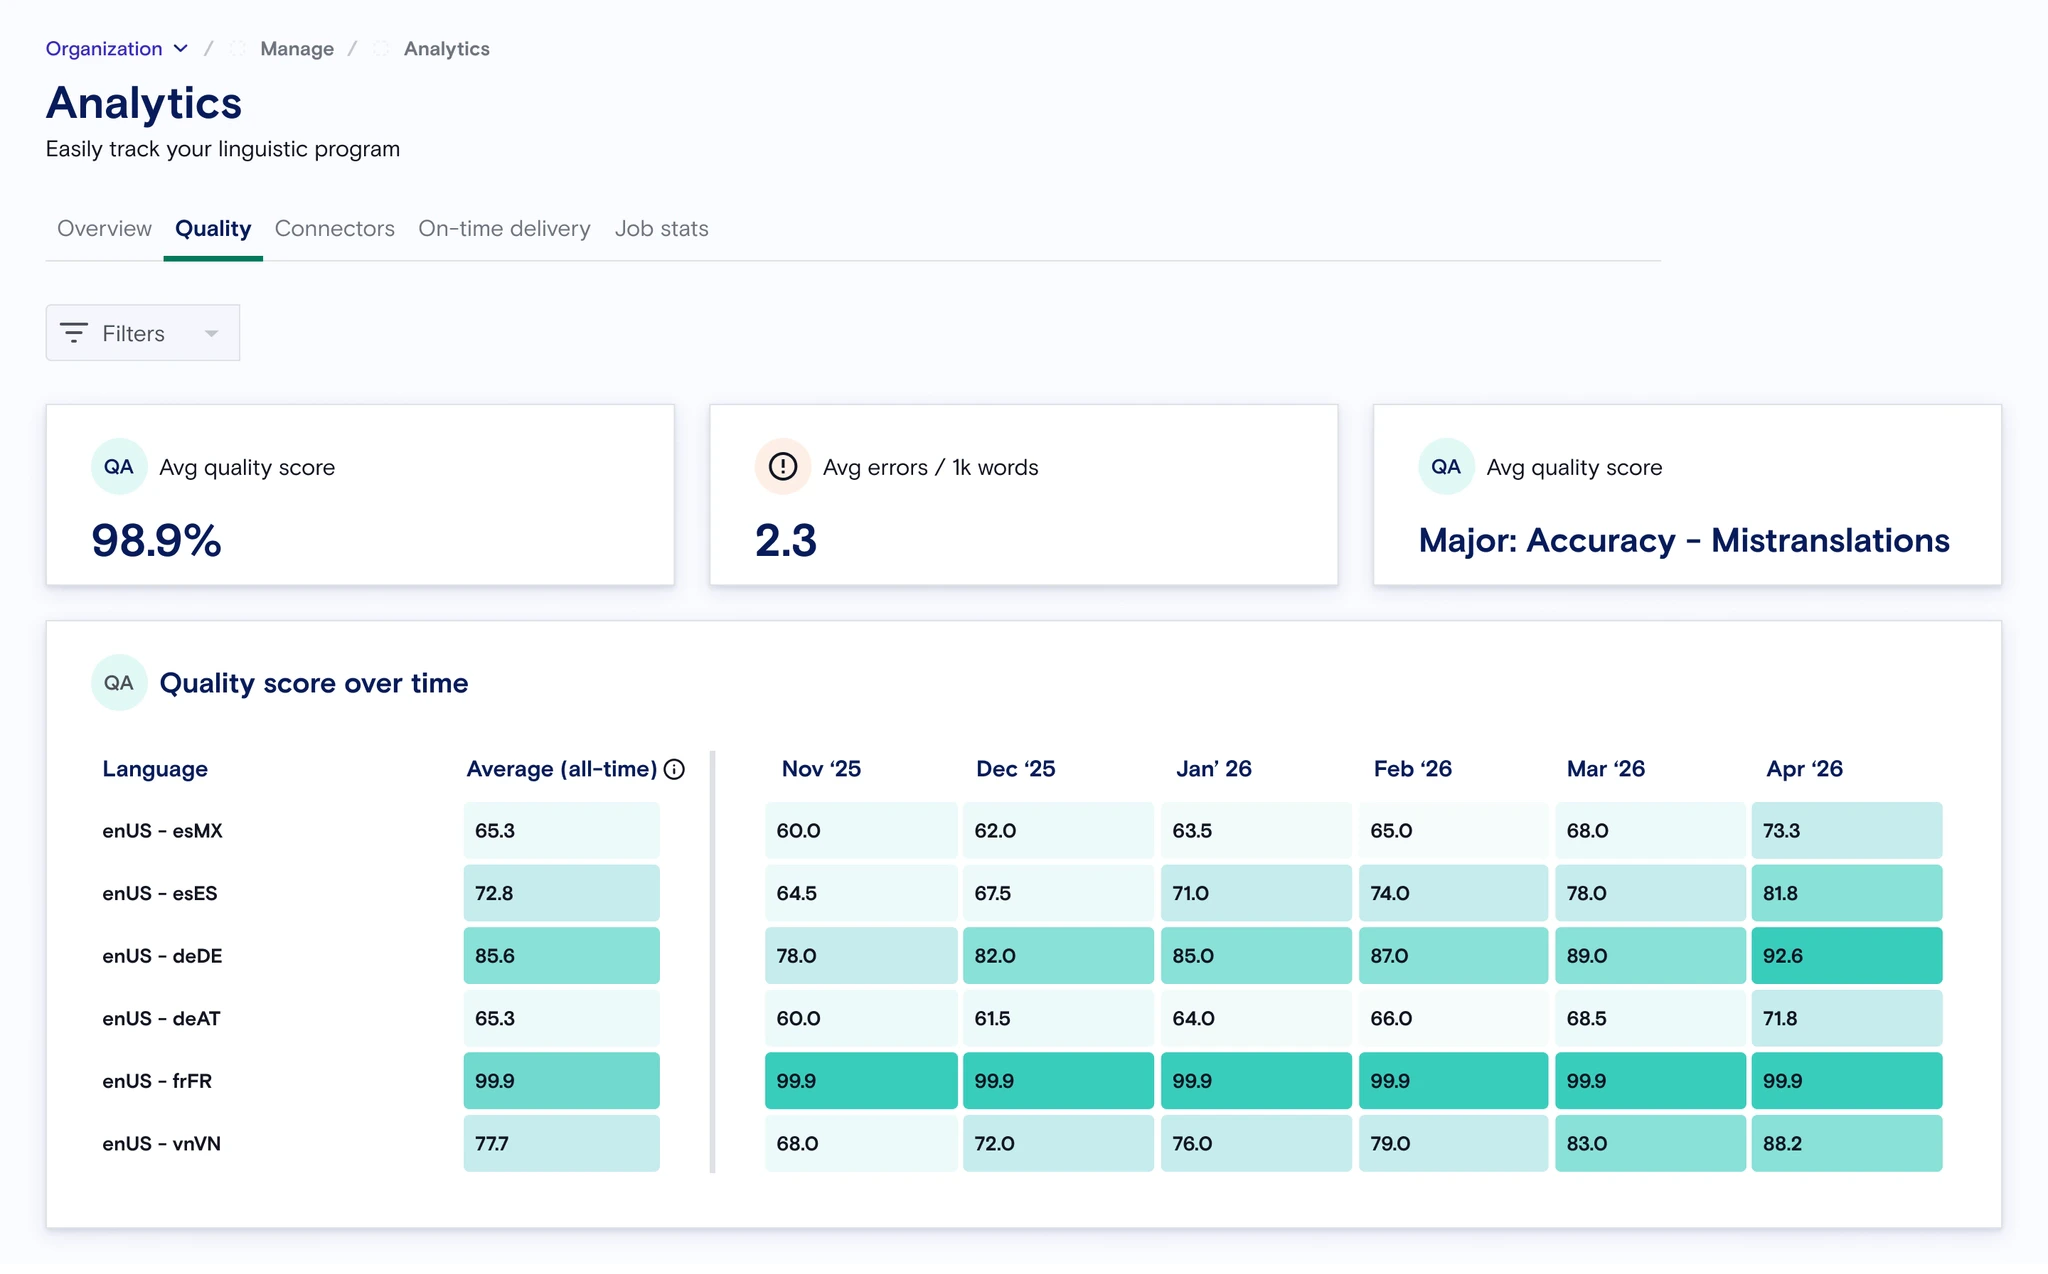
Connector Jobs
The “Connector Jobs” table provides insights into the performance of various connectors, including their AI accuracy, volume, and submission errors. This information helps identify which connectors perform well and which may need improvements. Jobs submitted directly via the API (i.e., not associated with a connector) are not included in the Connectors tab analytics.On-Time Delivery (OTD) and Words Per Hour (WPH)
- OTD Over Time: Tracks the on-time delivery performance of translations over several months.
- WPH Over Time: Monitors the words processed per hour, indicating the efficiency of the translation process.
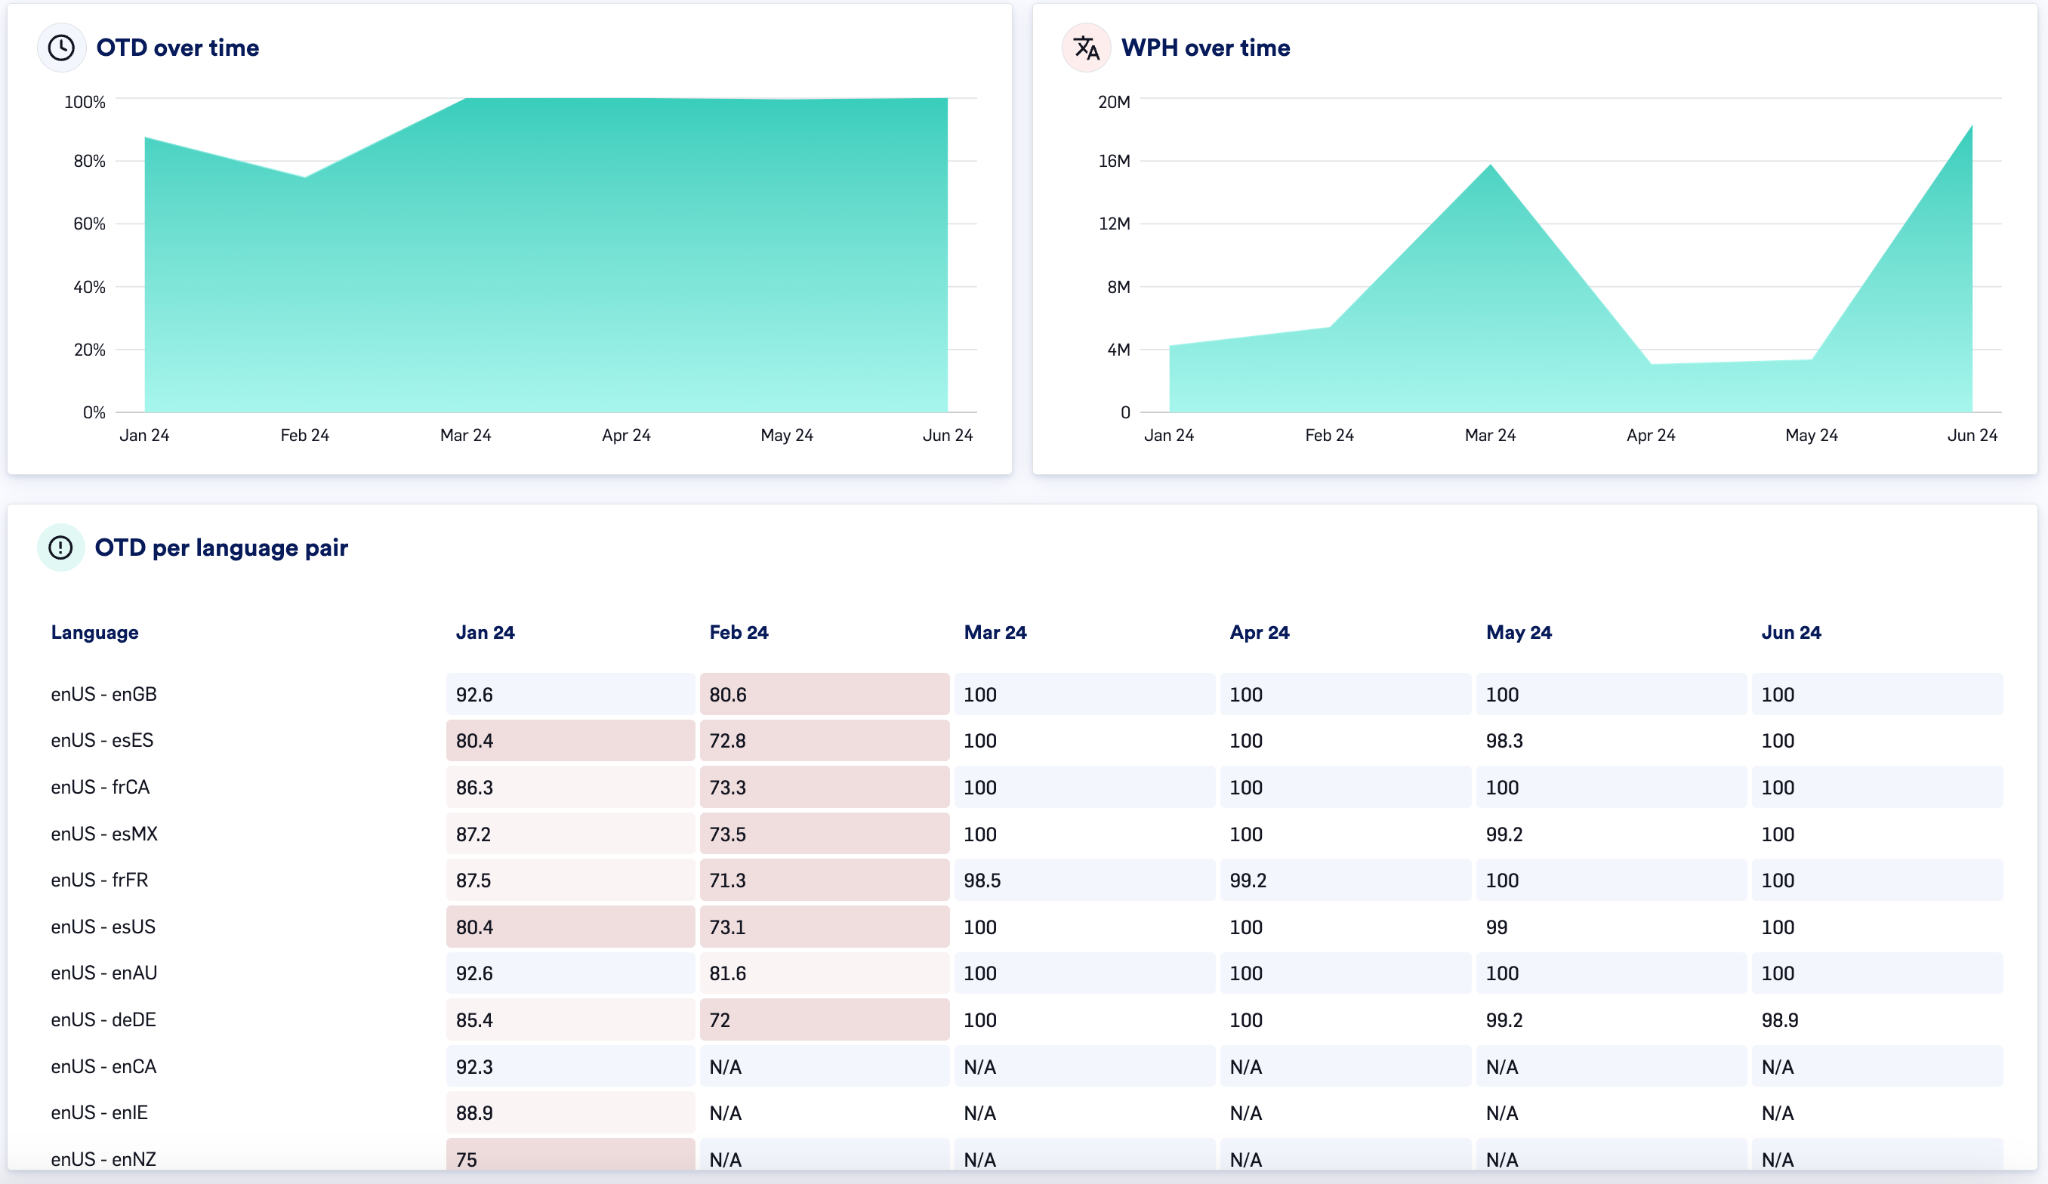
OTD and WPH metrics
OTD Per Language Pair
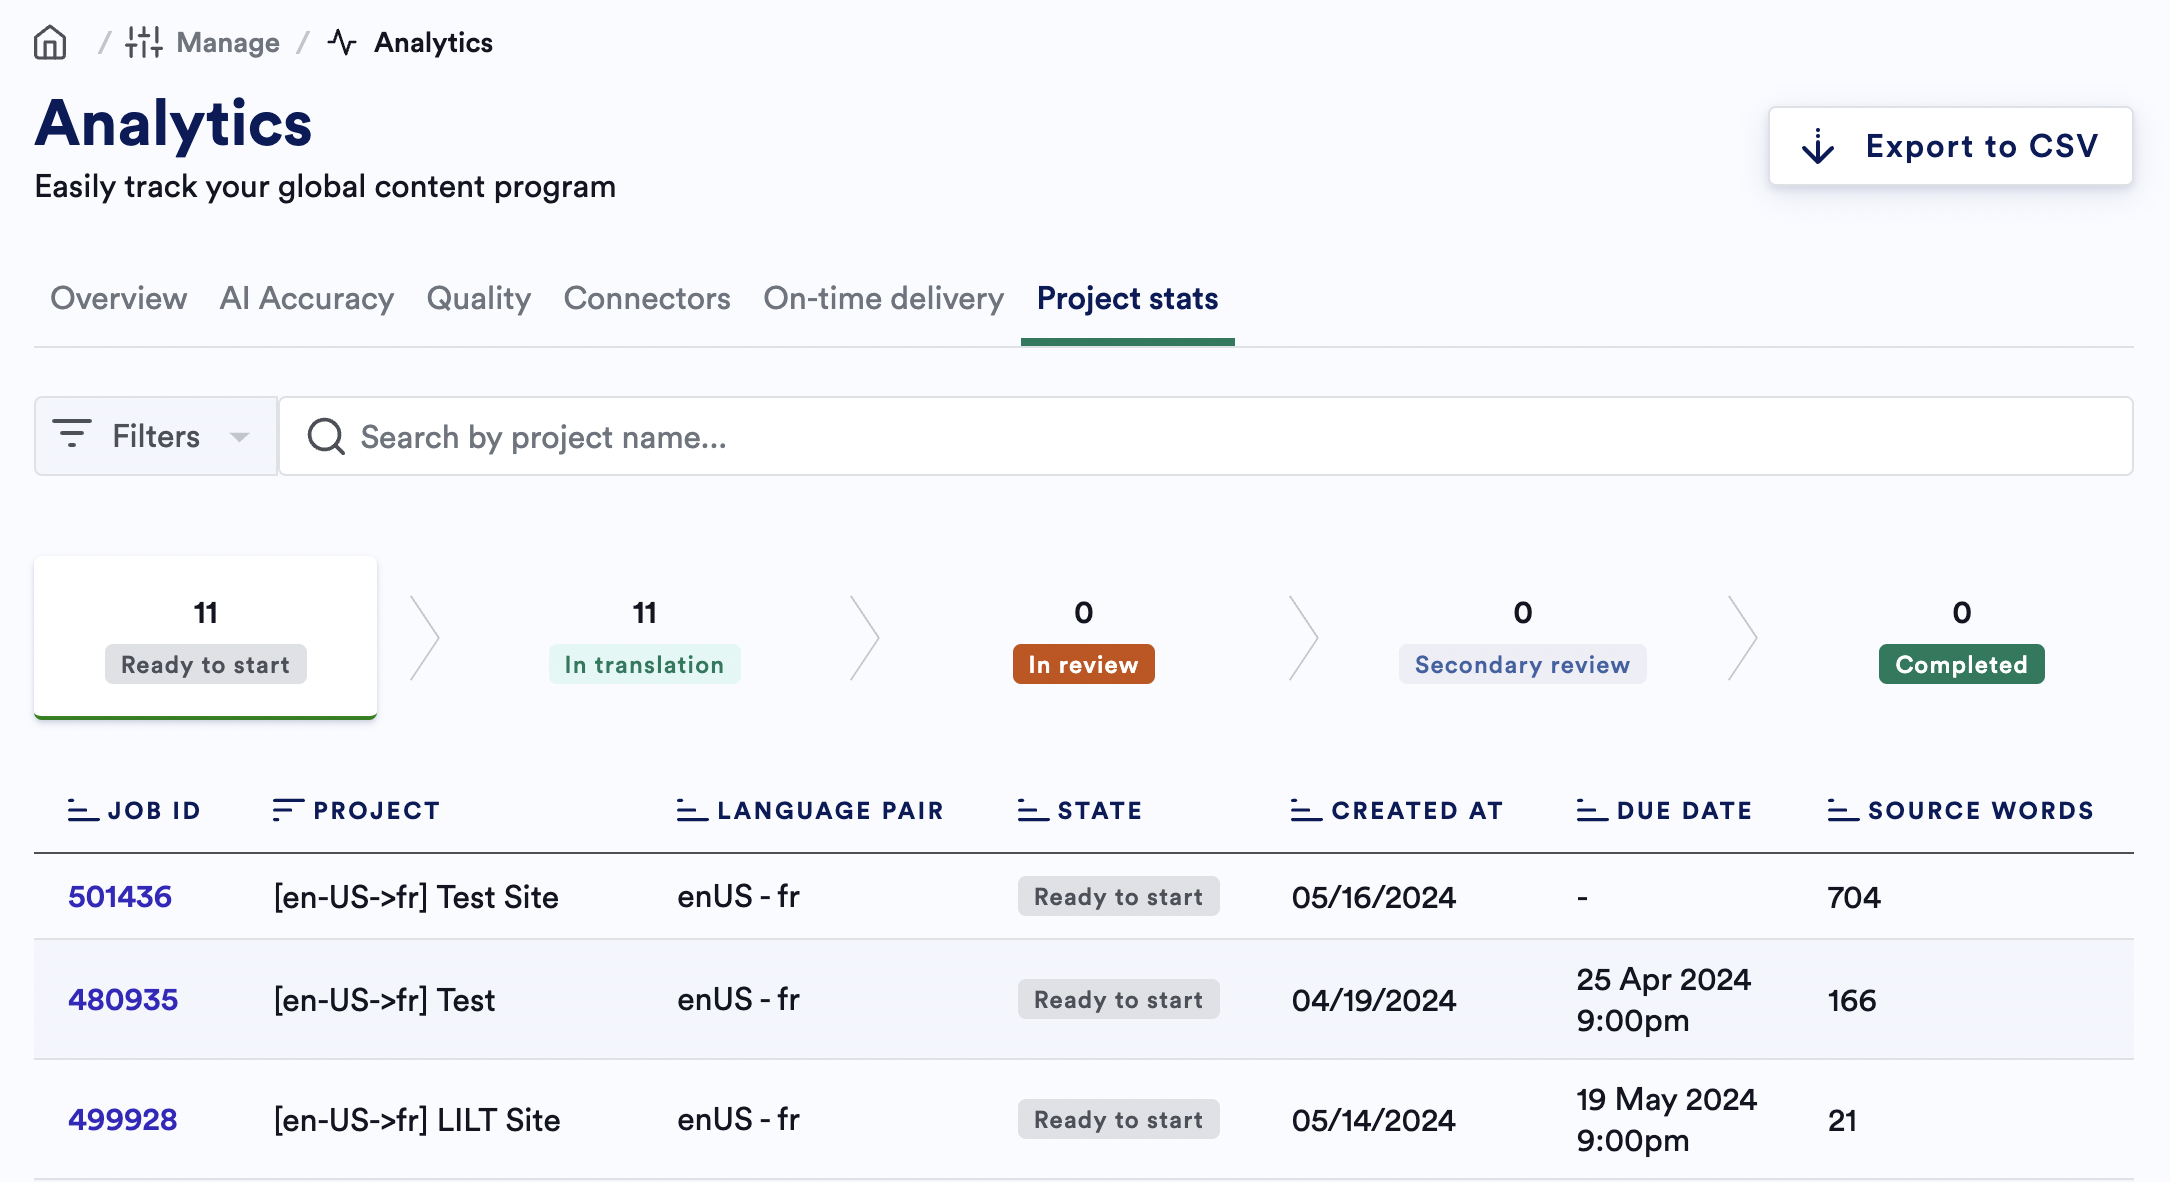
The “OTD Per Language Pair” table provides a breakdown of on-time delivery performance for different language pairs.Project Stats
Usage Analytics - Volume & User Activity tabs
VolumeUnderstand the total amount of translation work being done in LILT.
- Total Word Volume Translated: This is the total volume of words translated using LILT’s file Instant Translate feature. You can track this volume over time on a monthly basis to see how it increases or decreases.
- Per-User Volume: For any given month, you can drill down to see the Instant Translate volume on a per-user level. Click anywhere into the monthly charts to see a per-user volume breakdown in words.
- Total File Translate: See how many files translated total and which users are translating how many files.
Track user engagement with the LILT platform.
- Total User Logins: See the total number of user logins and track this metric over time.
- Monthly Drill-Down: Drilling down into a given month gives insights on the number of total logins, the number of unique users who logged in, and the number of total logins and their last login date on a user level. Click anywhere into the monthly charts to see a drilldown into the total logins per user and their last login date.